
The Rackham Doctoral Intern Fellowship Program allows doctoral students to pursue a fully supported internship as part of their graduate studies, providing mentored career experiences for Rackham students outside of academia. The program includes funding for internships with our partner organizations (with fall and winter application deadlines) and funding for internships that Rackham students self-identify (a rolling, year-round opportunity). Learn more: Rackham Doctoral Intern Fellowship Program.
In 2021, Michigan ranked third in a nationwide assessment of blood-lead levels in children; 78 percent of children who were tested had lead in their blood. Approximately 4,000 children in Michigan under the age of six have elevated blood lead levels, impacting IQ, attention span, academic achievement, and more.
“Looking at information and data like this can lead to feelings of despair. While it’s important and necessary to understand what’s going on, it’s also really important to get a clear look at solutions and what’s working,” says Rackham student Elsie Lee-Robbins, a Ph.D. candidate at the U-M School of Information. “Data visualization can help us do both.”
Funded by the Rackham Doctoral Intern Fellowship Program, Lee-Robbins served as a 2023 communications fellow at the Ecology Center, a nonprofit dedicated to working on local, state, and national levels on environmental justice, health, waste, and community issues. A data visualization scholar and practitioner, Lee-Robbins worked with the communications team to support many initiatives at the center, including efforts to eliminate lead poisoning in the state of Michigan.
“Data visualization can be very persuasive, especially in conjunction with stories,” Lee-Robbins says.
During her fellowship, Lee-Robbins created two-dimensional data visualizations of where children were experiencing the highest levels of lead poisoning in the state, by county. Additionally, she created a map of the data using Lego and a time-lapse video with voice-over describing both the process and the problem at hand.
“Data visualizations that bring an element of novelty can sometimes get people to engage with data at a little bit of a deeper level than maybe a simple bar chart or scatter plot might,” she says.
Getting the Job Done
In October 2023, Governor Gretchen Whitmer signed the bipartisan Filter First bill into law, protecting children in Michigan by requiring the installation of water filters in childcare centers and schools to prevent lead contamination.
“I was a newcomer to the Ecology Center, but I saw some of the effects of their long-term work educating policy makers and the general public about the dangers of lead and how we could solve the problem,” Lee-Robbins says. “To actually see policy addressing this issue was really exciting.”
During her time at the Ecology Center, Lee-Robbins also created data visualizations on a number of other environmental topics, including toxins found in receipt paper, PFAS awareness, and helping municipalities make more eco-friendly procurement decisions. She also led a mini-workshop for the Ecology Center’s communications team to share findings from her dissertation, which aims to help data visualization designers create more effective visualizations through defined communication goals and learning objectives.
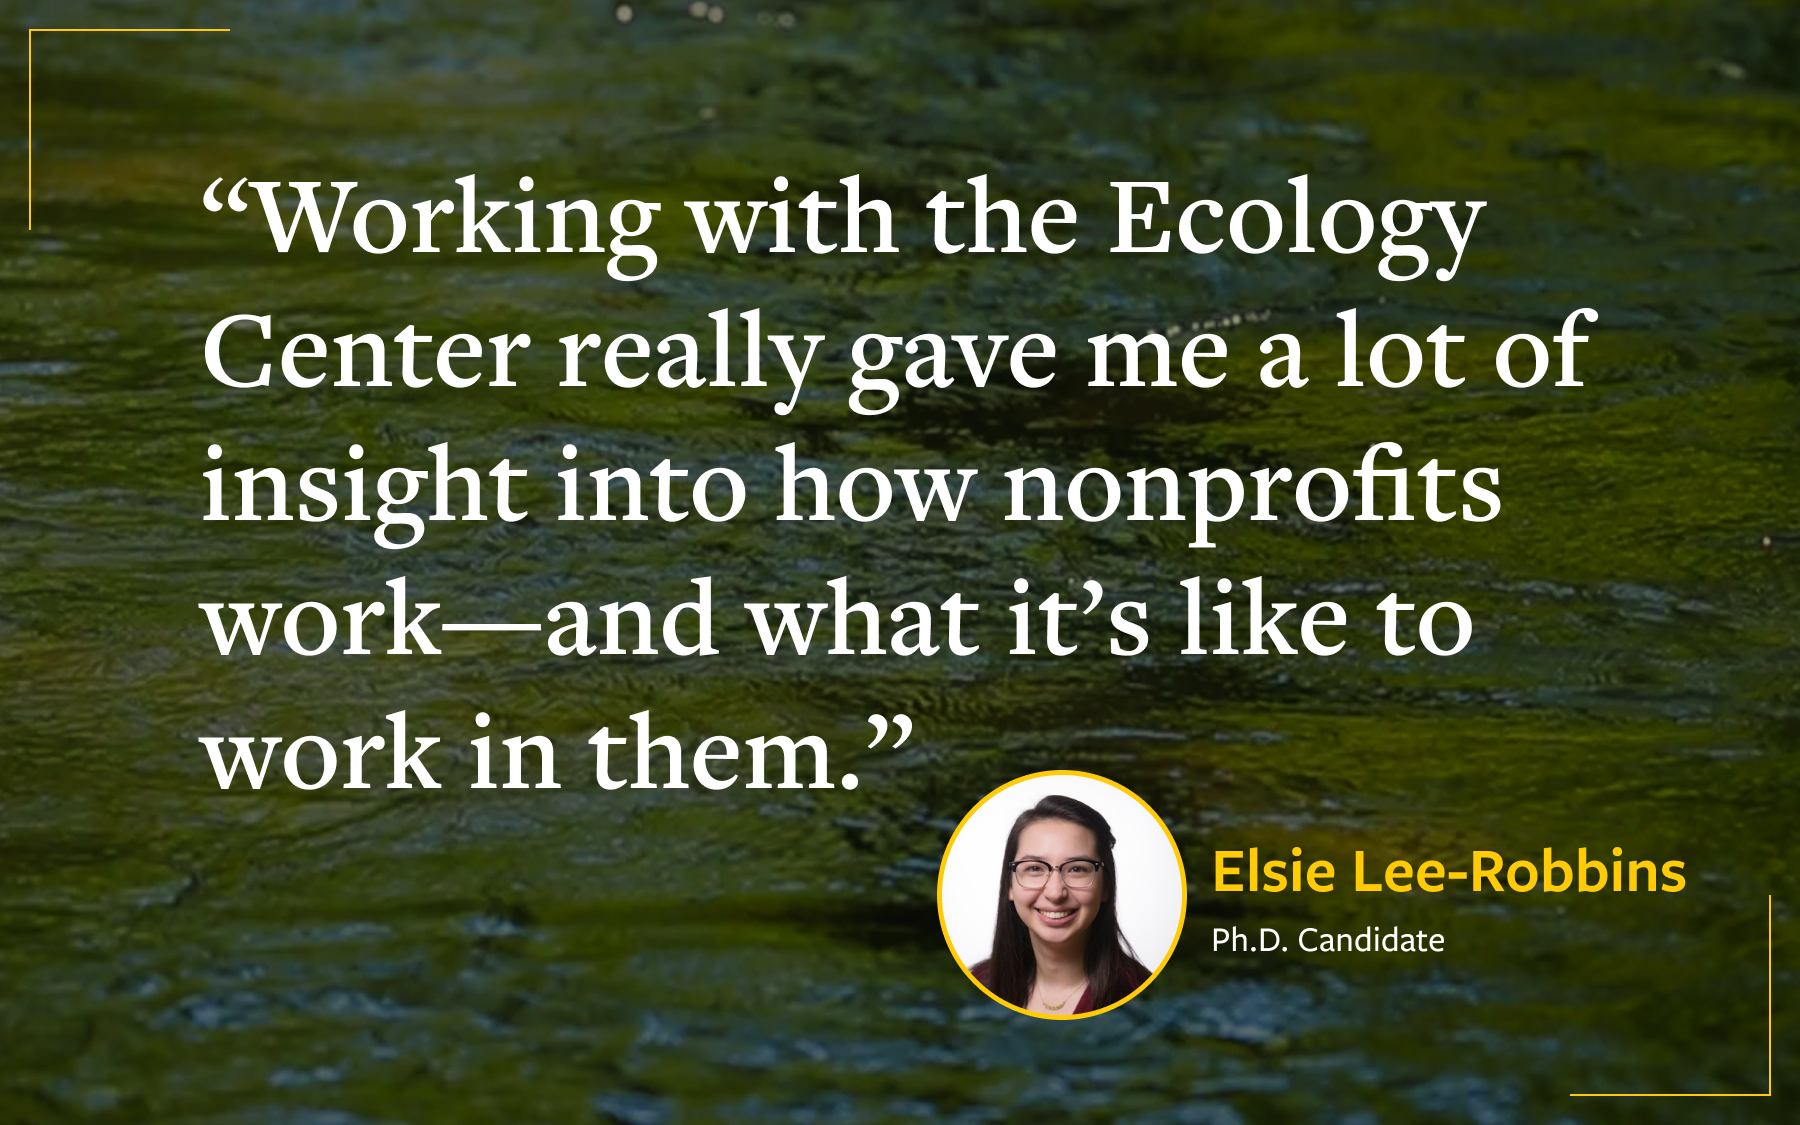
“I’ve had previous internship experiences in tech spaces like Microsoft, but the fellowship experience of working with the Ecology Center really gave me a lot of insight into how nonprofits work—and what it’s like to work in them,” she says.
Grad Student Advice
According to Lee-Robbins, the Ecology Center wasn’t hiring for a data visualization expert initially. Instead, the job posting sought a writer.
“My advice to grad students is to think about how your strengths could be applied to an organization. Even if it’s not exactly what the organization is proposing in their job description, they still might benefit from what you have to bring to the table,” Lee-Robbins says.
Lee-Robbins is also a proponent of maximizing your fellowship time with an organization by conducting informational interviews.
“Talk to the people at your organization and learn more about their experiences,” she says. “Informational interviews can really strengthen your professional network.”
While Lee-Robbins is eagerly exploring career opportunities after she graduates, she is adamant about the role of data visualization in helping humans understand complex issues and how to address them.
“We need to understand both our problems and their solutions in order to stay cautiously optimistic on what is possible for our future.”
How Rackham Helps
In addition to her participation in the Rackham Doctoral Intern Fellowship Program, Lee-Robbins is a recipient of three grants: The Rackham Graduate Student Research Grant, which allowed her to pay research participants as part of her dissertation work; the Rackham Conference Travel Grant, which provided funding to attend a data visualization conference; and the Rackham One-Term Dissertation Fellowship.
“Rackham has supported me throughout my Ph.D. program,” she says. “I’m very thankful to be awarded the Rackham One-Term Dissertation Fellowship, which is funding my research this semester. This grant allows me to focus full time on finishing my dissertation.”